 CAIN Web Service
Maps of Ireland and Northern Ireland
[CAIN_Home]
[Key_Events]
[Key_Issues]
[CONFLICT_BACKGROUND]
BACKGROUND: [Acronyms]
[Glossary]
[NI Society]
[Articles]
[Chronologies]
[People]
[Organisations]
[CAIN_Bibliography]
[Other_Bibliographies]
[Research]
[Photographs]
[Symbols]
[Murals]
[Posters]
[Maps]
[Internet]
Page Compiled: Martin Melaugh
Material is added to this site on a regular basis - information on this page may change
The following maps have been produced specifically for the CAIN site
Maps which appear in extracts from publications at the CAIN site
- McClean, Raymond. (1983) The Road to Bloody Sunday. Swords: Ward River.
Map of the Bogside area of Derry
- Pringle, Peter., and Jacobson, Philip. (2000) Those Are Real Bullets, Aren't They?: Bloody Sunday, Derry, 30 January 1972. London: Fourth Estate Limited.
Map of the Bogside and Creggan areas of Derry
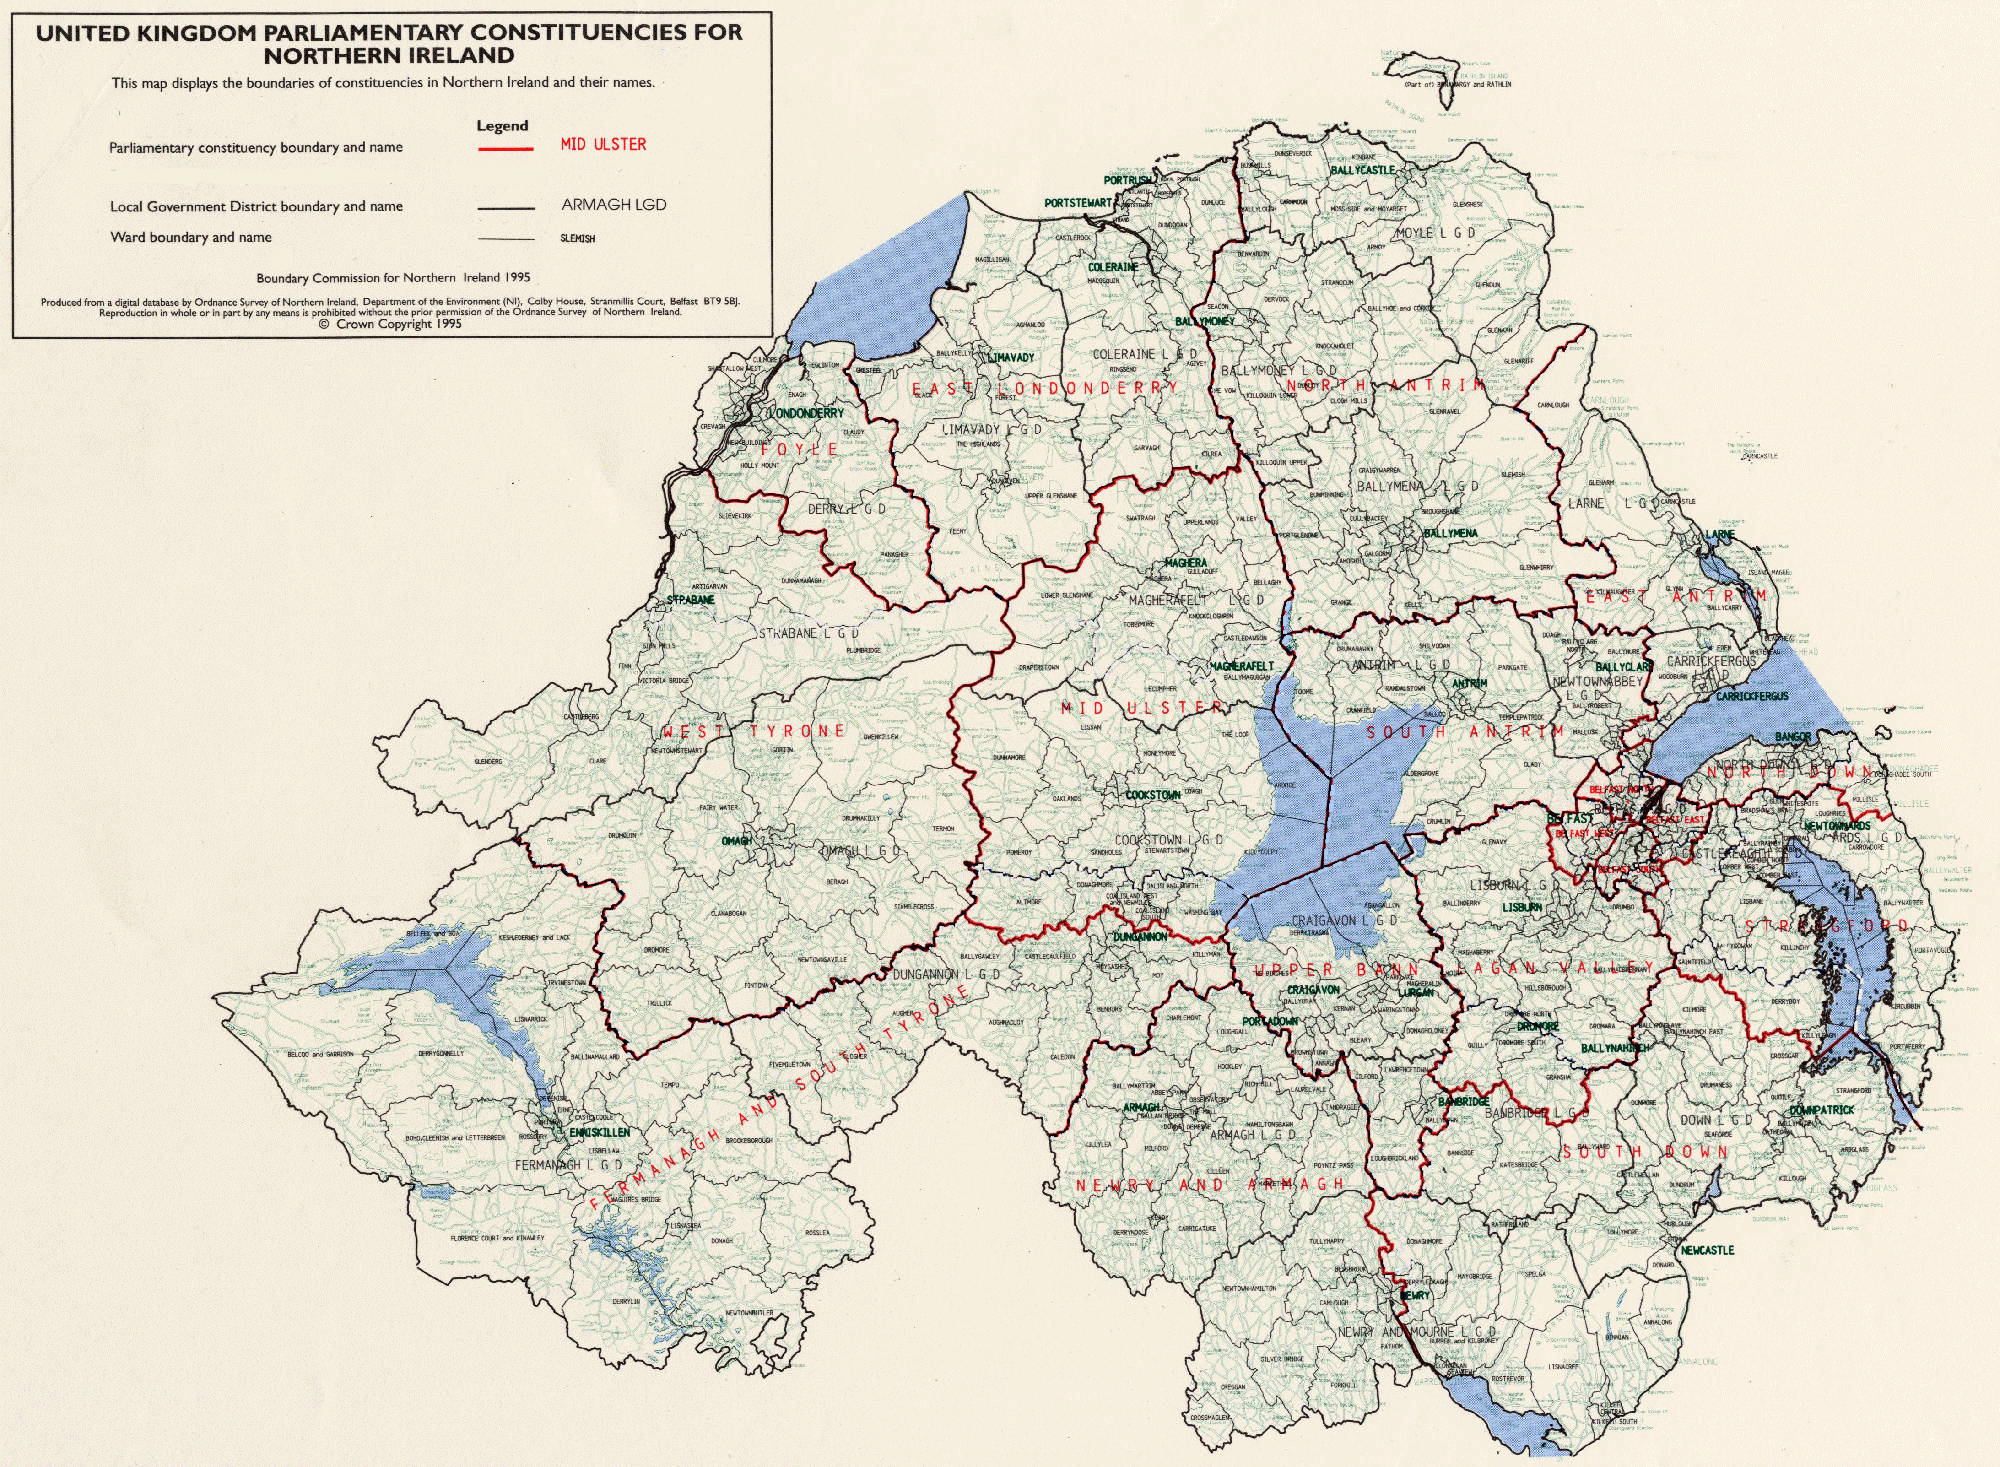
Map of Northern Ireland
Street map of Derry in 1972 showing the direction of the 'Bloody Sunday' march
Small map showing location of Glenfada Park North and South in Derry
- Northern Ireland Office (NIO). (1972) Bloody Friday, July 21, 1972 - Northern Ireland Office News-sheet. Belfast: Northern Ireland Office (NIO).
Map showing locations of bombs planted in Belfast on Bloody Friday, 21 July 1972 - McMonagle, Barney. (1997) NO GO - A Photographic Record of Free Derry. Derry: Guildhall Press.
Map of Derry showing the location of the Creggan and Bogside areas, and the city walls
- Great Britain. Parliament. (1972) Report of the Tribunal appointed to inquire into the events on Sunday, 30th January 1972, which led to loss of life in connection with the procession in Londonderry on that day, [Widgery Report], (HC 220), (18 April 1972). London: HMSO.
Detailed map of Londonderry (from the Widgery Report on Bloody Sunday)
Most of the following section is based on information obtain from the
The Ireland Story website {external_link}
Research: Shannon Fitzgerald
Street Maps of Towns & Cities |
|
Street map of Belfast, with 93 main roads and 18 prominent buildings named. Scale 72 pixels = 1km. [82kB] |
|
Map of Belfast divided into Electoral Wards. Each ward is coloured to indicate the proportion of Roman Catholics who make up the population. Scale 72 pixels = 1km. [98kB] |
|
Street map of Derry, with 80 main roads and 16 prominent buildings named. Scale 72 pixels = 1km. [46kB] |
|
Map of Derry divided into Electoral Wards. Each ward is coloured to indicate the proportion of Roman Catholics who make up the population. Scale 72 pixels = 1km. [34kB] |
|
Map showing the town centre in Omagh and the location of the August 15th 1998 bomb explosion. Approximate scale 600 pixels = 1km. [12kB] |
|
Map of the route of the Drumcree Orange parade and the Garvaghy Road area of Portadown, county Armagh. Also shows the area that is predominantly Roman Catholic. [19kB] |
Maps of Counties
|
Donegal
or same map at CAIN |
Map of county Donegal, province of Ulster [ROI], showing main towns, roads and mountains. Scale 5 pixels = 1km. [25kB] |
Fermanagh
or same map at CAIN |
Map of county Fermanagh, province of Ulster [UK], showing main towns, roads and mountains. Scale 5 pixels = 1km. [10kB] |
Leitrim
or same map at CAIN |
Map of county Leitrim, province of Connaught, showing main towns, roads and mountains. Scale 5 pixels = 1km. [10kB] |
Londonderry
or same map at CAIN |
Map of county Londonderry, province of Ulster [UK], showing main towns, roads and mountains. Scale 5 pixels = 1km. [13kB] |
Tyrone
or same map at CAIN |
Map of county Tyrone, province of Ulster [UK], showing main towns, roads and mountains. Scale 5 pixels = 1km. [14kB] |
| Historical Maps (arranged in chronological order) |
Ice Age Ireland
or same map at CAIN |
Map showing the extent of the ice coverage in Ireland as well as the locations of the lower coastline and glacial landforms. [19kB] |
Ireland 850AD
or same map at CAIN |
Map of Ireland as it was in 850AD, showing the main Celtic monastries, scenes of major Viking destruction and the main Viking settlements. [10kB] |
Ireland 1014
or same map at CAIN |
Map of Ireland in 1014AD, showing the main kingdoms ruled by Celtic and Viking monarchs. [13kB] |
Ireland 1300
or same map at CAIN |
Map of Ireland in 1300AD, showing the maximum extent of Norman control in Ireland and their main settlements. [11kB] |
Ireland 1450
or same map at CAIN |
Map of Ireland in 1450, during the Norman decline showing the Celtic areas, Anglo-Irish areas and the English-ruled Pale. [14kB] |
Ireland 1609
or same map at CAIN |
Map of Ireland in 1609, showing the 3 main Plantations that took place between 1556 and 1609. [11kB] |
Cromwell in Ireland
or same map at CAIN |
Two-in-one map of Ireland in 1641 and 1703 indicating the effect of Oliver Cromwell's period of rule of Britain and Ireland. Compares the proportion of land in each county in Ireland that was owned by Roman Catholics. [11kB] |
Poverty in Ireland, 1841
or same map at CAIN |
Map indicating the levels of poverty in Ireland on the eve of the Great Famine. An index based on literacy and housing standards. [11kB] |
Severity of the Famine, 1847
or same map at CAIN |
Map showing the varying level of severity of the Great Famine across Ireland at its height in 1847. [13kB] |
Population Fall in Ireland, 1841-1851
or same map at CAIN |
Detailed map showing the levels of population fall over the Famine period in each part of Ireland. [14kB] |
Irish Settlement in Britain, 1851
or same map at CAIN |
The locations in Britain where Irish-born who emigrated to Britain settled [5kB]. |
Protestants in Ireland, 1861 and 1991
or same map at CAIN |
Two-in-one colour-coded map showing the change in the distribution of Protestants in Ireland between 1861 and 1991. [13kB] |
Declining Protestant population in the Irish Republic 1891 to 1991
or same map at CAIN |
Graph showing the proportion of the population of the Irish Republic who were Protestant in censuses in the period 1891 to 1991. [7kB] |
Changing Republican Activity
or same map at CAIN |
Four-in-one map showing the changing level of Republican violence across Northern Ireland (1969/70, 1976, 1984 and 1993). [16kB] |
Changing Loyalist Activity
or same map at CAIN |
Four-in-one map showing the changing level of Loyalist violence across Northern Ireland (1969/70, 1976, 1984 and 1993). [15kB] |
Changing Army & RUC Activity
or same map at CAIN |
Four-in-one map showing the changing number of deaths attributable to British security forces in Northern Ireland (1969/70, 1976, 1984 and 1993). [15kB] |
|
